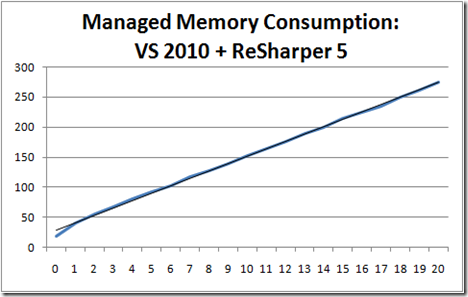
The final word on memory consumption for R# is still not said. It looks as if the jury is till out. But judge for yourself.
I ran the following experiment: I created a solution in VS 2010 with 5 projects in total. Three of the projects are libraries and two of the projects are ASP.NET web applications, one to host services and the other to host the web user interface. All projects are C# and targeting .NET 4.
Then I open a new instance of Visual Studio 2010 and switched on ReSharper’s feature to display the consumption of managed memory in the status bar. The starting value was 19 MBytes after opening VS and no solution loaded. Solution-wide analysis is turned off. The entire system is a laptop with 4 GByte RAM and 32-bit Vista Ultimate. All software is maintained automatically to receive the latest updates and hotfixes.
Next I repeated the following steps 20 times:
- Open Solution
- Note managed memory usage
- Close Solution
Then I plotted the result in a graph. The x-axis is the number of the iteration while the y-axis is the memory consumption in MBytes as reported by the number in the status line, which is an option of ReSharper. I also put a linear trend line on top of the graph. You will note that except for the very first value we seem to have linear trend:
I’m not an expert but based on my experience this graph does not indicate that this is caused by memory fragmentation. If it was memory fragmentation I would expect the growth to decrease and eventually to flatten out. In this case we see a perfectly linear trend which makes me believe that someone is holding on to memory. And I know for sure it’s not me!
Each opening of a solution eats about 11 MBytes of memory. Closing the solution – I thought – should give free all memory that was used up because of the solution being open.
But maybe I’m completely off here and out of my depth. In that case I beg you: Please help me understand!

2 comments:
See ( https://connect.microsoft.com/VisualStudio/feedback/details/526312/vs2010-very-high-memory-usage-very-slow : Posted by Microsoft on 19.04.2010 at 09:52 )
" if your expectation is that on closing the project you will get back all the memory used when the package that handles that project type loaded, you will be disappointed."
The answer you are referring to is different to what I have described here. Regardless of whether ReSharper is implemented as a "package" it will consume broadly speaking memory for two purposes: a) for its binaries and b) for data once a solution has been loaded. I don't expect the memory for the binaries back. I want back the memory it needs while a solution is loaded. I expect that memory back once the solution has been closed. The observation I describe is with regards to then working on a project and opening/closing it. With memory fragmentation and being implemented (almost) exclusively in .NET I expect the graph for the memory consumption to reach a maximum at some point. Or at the very least the incremental memory consumption should become smaller (the differential becomes smaller). However, memory consumption increases linearly (differential stays the same) which suggests that ReSharper in the version I used for the test contains a memory leak.
Post a Comment
All comments, questions and other feedback is much appreciated. Thank you!